Because I am starting this blog, here is a piece I wrote on November 11th. Happy Veterans’ Day!
The Graphical Data Presentation Award O’ the Day goes to Janice Kai Chen, a journalist for the Washington Post who created this wonderful chart. It shows when the combination of broadband speed, distance, and data size would make it faster to use a carrier pigeon than it would be to use the Internet when sending vacation photos to your grandchildren:
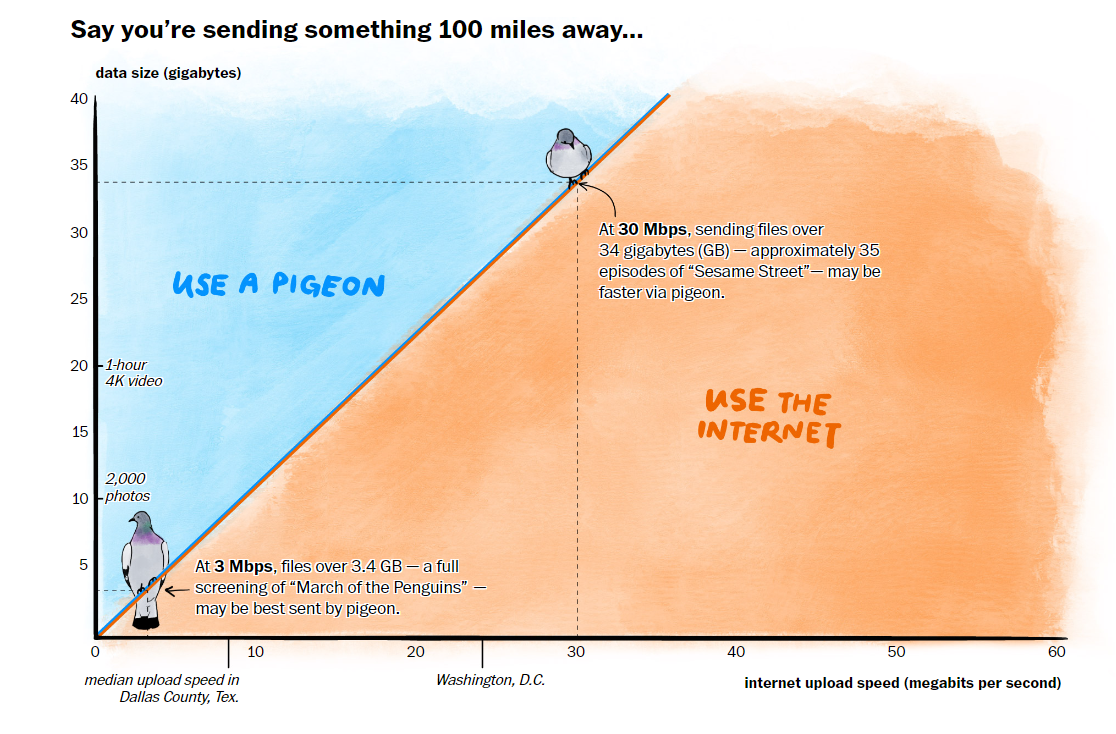
You can’t make this stuff up. The conclusion here is that for relatively short, inter-city data transport (like the distance between New York and Philadelphia), put the data on a USB stick, tie it to a carrier pigeon, and let it go. And also important: keep a copy! Pigeons can get lost over Trenton! Ms. Chen is a graphic journalist for the Post; did you know there was such a thing? I didn’t. She has a Master’s degree in Geography, which seems to work well for this job.
And FYI, the state with the median download speed in the US is Indiana, at 29 Mbps, or “mega” bits per second (this is from FastMetrics), putting Indiana in the middle of the chart above. Delaware, at 59, wins while Alaska, at 9.94 Mbps, brings up the tail end. The economics seem to favor more densely populated areas where the provider can spread the investment in equipment over more customers. My computers benefit from a 1 Gbps connection (I live in a densely populated area, which is about 100 times faster than the median Alaska bandwidth.
On a personal note, my wife’s grandparents raised pigeons in Illinois, and I recently mailed a USB stick to a cousin in Hawaii with 8 gigabytes of vacation pictures (or 64 gigabits of Internet data) because his Internet connection is slower than mine, and he didn’t want to wait forever for the download. So I love this chart!
